Using GRNPipeline#
A GRN analysis and visualization tool for the gene of interest#
First, the data and package are loaded. This may take a minute. Set your gene of interest (GOI) here!
[31]:
import sys
sys.path.append('/lustre/groups/ml01/workspace/samantha.bening/Bachelor/')
from importlib import reload
import genereporter.grn_pipeline as ggModule
reload(ggModule)

gg = ggModule.GRNPipeline(wdir="/lustre/groups/ml01/workspace/samantha.bening/Bachelor/",
                          adata="data2/veo_ibd_balanced_aucell.h5ad",
                          f_adj='src/SCENICfiles/TFtg_adj.csv',
                          f_reg='src/SCENICfiles/reg_full10k.csv',
                          dir_gg_adj = 'src/SCENICfiles/gg_adj/',
                          gg_adj_files=['gg_adj_B_Cell.csv', 'gg_adj_Epithelium.csv',
                                        'gg_adj_Myeloid.csv', 'gg_adj_Stroma.csv', 'gg_adj_T_Cell.csv'])

# set GOI
GOI = 'CASP8'
A ranked list of the REACTOME pathway and GRN regulon gene sets that include the GOI. The ranking is based on the (absolute value of the) Spearman’s correlation coefficient between the genesets AUCell score and the GOI’s expression across all cells.
[2]:
pathways_goi = gg.get_goi_pathways(GOI)
pathways_goi
[2]:
| geneset | genesymbol | correlation | |
|---|---|---|---|
| 0 | REACTOME_REGULATION_OF_NF_KAPPA_B_SIGNALING | CASP8 | 0.240202 |
| 1 | REACTOME_CASPASE_ACTIVATION_VIA_DEATH_RECEPTOR... | CASP8 | 0.225575 |
| 2 | REACTOME_INTRINSIC_PATHWAY_FOR_APOPTOSIS | CASP8 | 0.220298 |
| 3 | REACTOME_NOD1_2_SIGNALING_PATHWAY | CASP8 | 0.202713 |
| 4 | REACTOME_NUCLEOTIDE_BINDING_DOMAIN_LEUCINE_RIC... | CASP8 | 0.201034 |
| 5 | REACTOME_REGULATED_NECROSIS | CASP8 | 0.200855 |
| 6 | REACTOME_RIPK1_MEDIATED_REGULATED_NECROSIS | CASP8 | 0.196787 |
| 7 | REACTOME_C_TYPE_LECTIN_RECEPTORS_CLRS | CASP8 | 0.192598 |
| 8 | REACTOME_CASPASE_ACTIVATION_VIA_EXTRINSIC_APOP... | CASP8 | 0.190844 |
| 9 | REACTOME_TNF_SIGNALING | CASP8 | 0.183101 |
| 10 | REACTOME_TAK1_DEPENDENT_IKK_AND_NF_KAPPA_B_ACT... | CASP8 | 0.181794 |
| 11 | REACTOME_CLEC7A_DECTIN_1_SIGNALING | CASP8 | 0.173996 |
| 12 | REACTOME_PROGRAMMED_CELL_DEATH | CASP8 | 0.173493 |
| 13 | REACTOME_DDX58_IFIH1_MEDIATED_INDUCTION_OF_INT... | CASP8 | 0.164175 |
| 14 | REACTOME_APOPTOSIS | CASP8 | 0.164043 |
| 15 | REACTOME_DEATH_RECEPTOR_SIGNALING | CASP8 | 0.160035 |
| 16 | REACTOME_INTERLEUKIN_1_FAMILY_SIGNALING | CASP8 | 0.152561 |
| 17 | REACTOME_INTERLEUKIN_1_SIGNALING | CASP8 | 0.151888 |
| 18 | REACTOME_DISEASES_OF_PROGRAMMED_CELL_DEATH | CASP8 | 0.147965 |
| 19 | REACTOME_TNFR1_INDUCED_PROAPOPTOTIC_SIGNALING | CASP8 | 0.146780 |
| 20 | REACTOME_APOPTOTIC_EXECUTION_PHASE | CASP8 | 0.129255 |
| 21 | REACTOME_MYD88_INDEPENDENT_TLR4_CASCADE | CASP8 | 0.118571 |
| 22 | IKZF2_REGULON | CASP8 | 0.108758 |
| 23 | REACTOME_APOPTOTIC_CLEAVAGE_OF_CELLULAR_PROTEINS | CASP8 | 0.103956 |
| 24 | IKZF1_REGULON | CASP8 | 0.103613 |
| 25 | ELF1_REGULON | CASP8 | 0.100515 |
| 26 | GATA3_REGULON | CASP8 | 0.096939 |
| 27 | CREM_REGULON | CASP8 | 0.096684 |
| 28 | REACTOME_TOLL_LIKE_RECEPTOR_CASCADES | CASP8 | 0.095853 |
| 29 | REACTOME_TOLL_LIKE_RECEPTOR_9_TLR9_CASCADE | CASP8 | 0.094180 |
| 30 | REACTOME_TOLL_LIKE_RECEPTOR_TLR1_TLR2_CASCADE | CASP8 | 0.091920 |
| 31 | RUNX3_REGULON | CASP8 | 0.090005 |
| 32 | IRF1_REGULON | CASP8 | 0.054595 |
| 33 | STAT1_REGULON | CASP8 | -0.019003 |
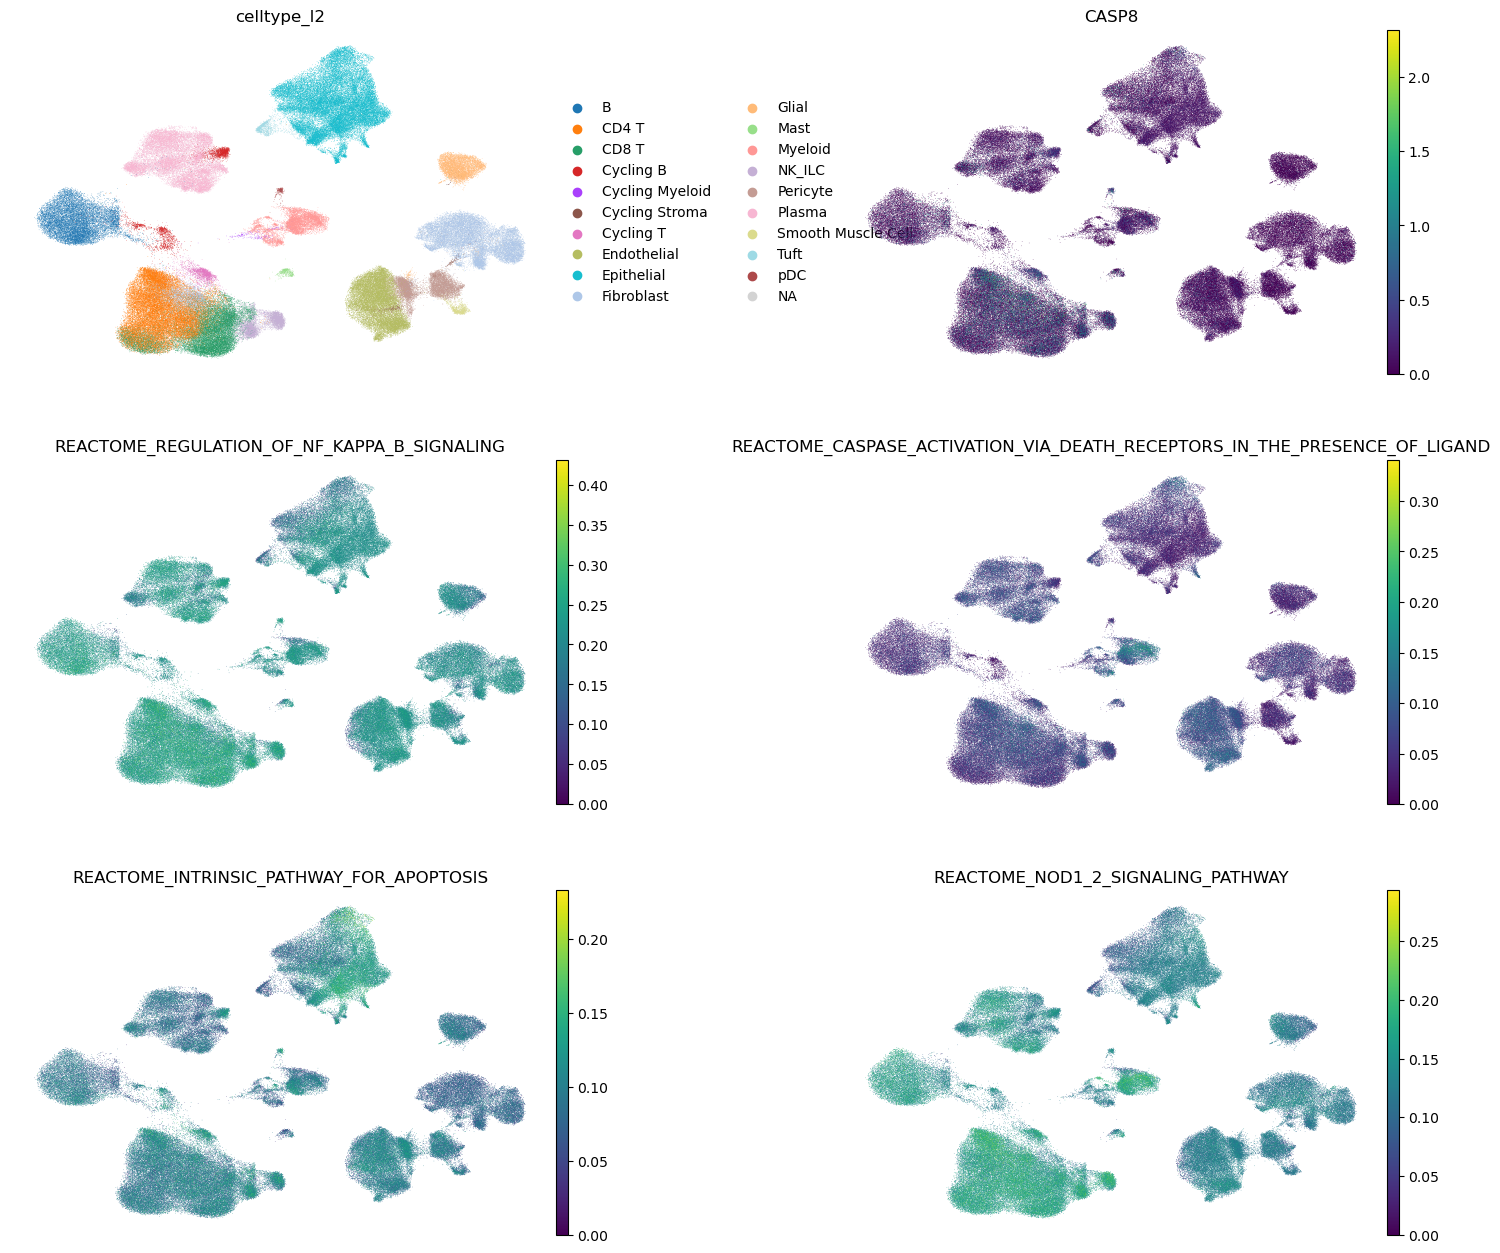
We show the UMAPs of all the cells, first colored by cell type, then by the GOI expression, followed by the top four gene sets (according to the previous ranking). The color of the pathways corresponds to the AUCell score of that gene set in every cell.
[3]:
gg.plot_pathways(pathways_goi, GOI)
Regulon-level gene set enrichment analysis#
Now we look into which pathways are significantly enriched in a specific gene set of interest. You can pick which gene set to look at by setting the regulon parameter: regulon=[‘your gene set’] We recommend looking at regulons, but you can also look at a REACTOME gene set. Hover over the individual pathways plotted to see more information.
[5]:
gprofiler = gg.gGOSt(regulon='IKZF2_REGULON') # set gene set of interest here
TF-Target Gene Network Visualization#
Now we can begin to look into specific TF-GOI pairs in the regulon network.
[2]:
# GOI text summary:
goi_grn = gg.make_goi_grn(GOI=GOI)
gg.GOI_network_stats(goi_grn, GOI)
gg.format_gene_summary(goi_grn, GOI)
Summary of CASP8:

There are 8 regulons that have CASP8 in their target genes.

Regulons that have CASP8 in their target genes:

        (TF: GRNBoost2 Importance Score)
        IKZF2: 0.583
        IRF1: 0.479
        ELF1: 0.33
        RUNX3: 0.177
        GATA3: 0.161
        CREM: 0.122
        IKZF1: 0.106
        STAT1: 0.1


There are 77 TFs for CASP8 that were NOT supported by a regulon (motif analysis),
here are the top 10:

        (TF: GRNBoost2 Importance Score)
        YWHAZ: 2.754
        EZR: 2.1
        UBE2K: 1.437
        SOD1: 1.025
        ZNF529: 0.961
        LEF1: 0.911
        KLF6: 0.823
        SFPQ: 0.7
        ZNF275: 0.687
        PSMD12: 0.673
        HDAC1: 0.562

CASP8:

        This gene encodes a member of the cysteine-aspartic acid protease (caspase) family.
        Sequential activation of caspases plays a central role in the execution-phase of
        cell apoptosis. Caspases exist as inactive proenzymes composed of a prodomain, a
        large protease subunit, and a small protease subunit. Activation of caspases requires
        proteolytic processing at conserved internal aspartic residues to generate a heterodimeric enzyme
        consisting of the large and small subunits. This protein is involved in
        the programmed cell death induced by Fas and various apoptotic stimuli. The
        N-terminal FADD-like death effector domain of this protein suggests that it may
        interact with Fas-interacting protein FADD. This protein was detected in the insoluble
        fraction of the affected brain region from Huntington disease patients but not
        in those from normal controls, which implicated the role in neurodegenerative diseases.
        Many alternatively spliced transcript variants encoding different isoforms have been described, although
        not all variants have had their full-length sequences determined. [provided by RefSeq,
        Jul 2008]

IKZF2:

        This gene encodes a member of the Ikaros family of zinc-finger proteins.
        Three members of this protein family (Ikaros, Aiolos and Helios) are hematopoietic-specific
        transcription factors involved in the regulation of lymphocyte development. This protein forms
        homo- or hetero-dimers with other Ikaros family members, and is thought to
        function predominantly in early hematopoietic development. Multiple transcript variants encoding different isoforms
        have been found for this gene, but the biological validity of some
        variants has not been determined. [provided by RefSeq, Jul 2008]

IRF1:

        The protein encoded by this gene is a transcriptional regulator and tumor
        suppressor, serving as an activator of genes involved in both innate and
        acquired immune responses. The encoded protein activates the transcription of genes involved
        in the body's response to viruses and bacteria, playing a role in
        cell proliferation, apoptosis, the immune response, and DNA damage response. This protein
        represses the transcription of several other genes. As a tumor suppressor, it
        both suppresses tumor cell growth and stimulates an immune response against tumor
        cells. Defects in this gene have been associated with gastric cancer, myelogenous
        leukemia, and lung cancer. [provided by RefSeq, Aug 2017]

ELF1:

        This gene encodes an E26 transformation-specific related transcription factor. The encoded protein
        is primarily expressed in lymphoid cells and acts as both an enhancer
        and a repressor to regulate transcription of various genes. Alternative splicing results
        in multiple transcript variants. [provided by RefSeq, Feb 2009]

RUNX3:

        This gene encodes a member of the runt domain-containing family of transcription
        factors. A heterodimer of this protein and a beta subunit forms a
        complex that binds to the core DNA sequence 5'-PYGPYGGT-3' found in a
        number of enhancers and promoters, and can either activate or suppress transcription.
        It also interacts with other transcription factors. It functions as a tumor
        suppressor, and the gene is frequently deleted or transcriptionally silenced in cancer.
        Alternative splicing results in multiple transcript variants. [provided by RefSeq, Mar 2016]

GATA3:

        This gene encodes a protein which belongs to the GATA family of
        transcription factors. The protein contains two GATA-type zinc fingers and is an
        important regulator of T-cell development and plays an important role in endothelial
        cell biology. Defects in this gene are the cause of hypoparathyroidism with
        sensorineural deafness and renal dysplasia. [provided by RefSeq, Nov 2009]

CREM:

        This gene encodes a bZIP transcription factor that binds to the cAMP
        responsive element found in many viral and cellular promoters. It is an
        important component of cAMP-mediated signal transduction during the spermatogenetic cycle, as well
        as other complex processes. Alternative promoter and translation initiation site usage allows
        this gene to exert spatial and temporal specificity to cAMP responsiveness. Multiple
        alternatively spliced transcript variants encoding several different isoforms have been found for
        this gene, with some of them functioning as activators and some as
        repressors of transcription. [provided by RefSeq, Jul 2008]

IKZF1:

        This gene encodes a transcription factor that belongs to the family of
        zinc-finger DNA-binding proteins associated with chromatin remodeling. The expression of this protein
        is restricted to the fetal and adult hemo-lymphopoietic system, and it functions
        as a regulator of lymphocyte differentiation. Several alternatively spliced transcript variants encoding
        different isoforms have been described for this gene. Most isoforms share a
        common C-terminal domain, which contains two zinc finger motifs that are required
        for hetero- or homo-dimerization, and for interactions with other proteins. The isoforms,
        however, differ in the number of N-terminal zinc finger motifs that bind
        DNA and in nuclear localization signal presence, resulting in members with and
        without DNA-binding properties. Only a few isoforms contain the requisite three or
        more N-terminal zinc motifs that confer high affinity binding to a specific
        core DNA sequence element in the promoters of target genes. The non-DNA-binding
        isoforms are largely found in the cytoplasm, and are thought to function
        as dominant-negative factors. Overexpression of some dominant-negative isoforms have been associated with
        B-cell malignancies, such as acute lymphoblastic leukemia (ALL). [provided by RefSeq, May
        2014]

STAT1:

        The protein encoded by this gene is a member of the STAT
        protein family. In response to cytokines and growth factors, STAT family members
        are phosphorylated by the receptor associated kinases, and then form homo- or
        heterodimers that translocate to the cell nucleus where they act as transcription
        activators. The protein encoded by this gene can be activated by various
        ligands including interferon-alpha, interferon-gamma, EGF, PDGF and IL6. This protein mediates the
        expression of a variety of genes, which is thought to be important
        for cell viability in response to different cell stimuli and pathogens. The
        protein plays an important role in immune responses to viral, fungal and
        mycobacterial pathogens. Mutations in this gene are associated with Immunodeficiency 31B, 31A,
        and 31C. [provided by RefSeq, Jun 2020]
Gene-gene Co-Expression Network#
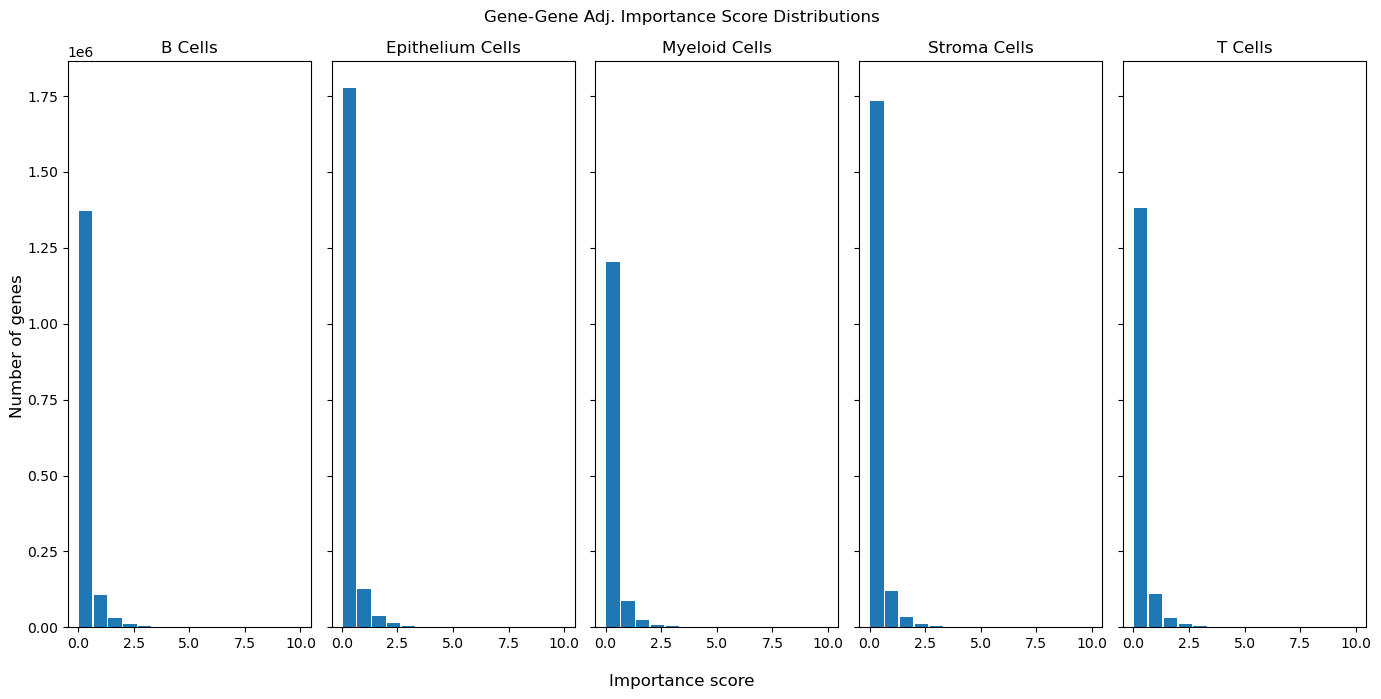
We can also look into not only TF-target gene regulatory relationships, but simple gene-gene co-expression patterns. Here, we show a gene-gene co-expression matrix for each very coarse cell lineage: B Cells, Epithelium Cells, Myeloid Cells, Stroma Cells, and T Cells. Each network is calculated using only gene expression values within these cell lineages. This means that the results here are cell-lineage specific.
[18]:
# first: look at importance score distribution for each cell lineage
# set log_scale=True for a log scale of the y-axis (Number of genes)
# set xlim=x for a view of the x-axis from 0 to x
gg.genegene_importance_histograms(log_scale=False, xlim=10)
You can visualize either the regulon (TF-GOI regulating pairs) or gene-gene (GOI-gene coexpressed pairs) network here. Set the parameter to ‘regulon’ or ‘gene_gene’ for the desired network visualization. The output is interactive, so hover over nodes to see their gene set and move nodes around for a better view!
[ ]:
# network visualization
# type = 'gene_gene' for the GOI-gene co-expression network
# type = 'regulon' for the TF-GOI regulon network
# top_n = n: only show top n direct target genes of each TF or gene

gg.show_network(GOI, type='regulon', top_n=5) # only works on jupyter notebook running in browser (not in VS Code for example)
We apply the same principle of gene set enrichment analysis within the genes that are co-expressed with the GOI in each distinct cell lineage. We simply provide a list of the top three (or less) significantly enriched pathways from REACTOME and KEGG for each gene set, i.e. each set of genes co-expressed with the GOI within each cell lineage.
[5]:
gg.gGOSt_listed(GOI)
Top 3 significantly differentially expressed pathways in genes co-expressed with CASP8, per cell lineage.
This is in REACTOME and KEGG databases.

In b_cell cells:
Chemical carcinogenesis - reactive oxygen species (p-value: 6.962516250823133e-05)
Parkinson disease (p-value: 9.276781736818912e-05)
Pathways of neurodegeneration - multiple diseases (p-value: 0.00029275472393432405)


In epithelium cells:
Salmonella infection (p-value: 0.0006470528854317268)
Endosomal/Vacuolar pathway (p-value: 0.0028136518951242927)
EPH-Ephrin signaling (p-value: 0.006122716684392412)


In myeloid cells:
Viral myocarditis (p-value: 0.006700895160108687)
mRNA Splicing (p-value: 0.013791609164411713)
Interferon gamma signaling (p-value: 0.02805819662400579)


In stroma cells:
No significant pathways found.


In t_cell cells:
mRNA Splicing - Major Pathway (p-value: 0.0044740380794107)
mRNA Splicing (p-value: 0.006595281995211552)